Metro Realty Real Estate Market Report – November 2023
Follow us for current Arizona Real Estate Market information
Facebook @MetroRealtyAZ Instagram @MetroRealtyAZ
Arizona Real Estate Market Report November 2023
Arizona Real Estate Market – November 2023 Stats
Market Summary Towards the Ending of 2023
Here are the basics – the ARMLS numbers for November 1, 2023 compared with November 1, 2022 for all areas & types:
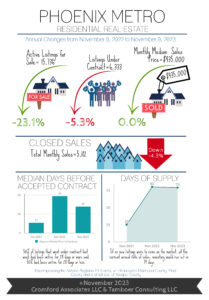
- Active Listings (excluding UCB & CCBS): 15,247 versus 20,582 last year – down 26% – but up 14% from 13,404 last month
- Active Listings (including UCB & CCBS): 17,364 versus 22,749 last year – down 24% – but up 11% compared with 15,639 last month
- Pending Listings: 3,911 versus 4,411 last year – down 11% – and down 8.3% from 4,264 last month
- Under Contract Listings (including Pending, CCBS & UCB): 6,028 versus 6,578 last year – down 8.4% – and down 7.2% from 6,499 last month
- Monthly Sales: 5,177 versus 5,420 last year – down 4.5% – and down 5.4% from 5,472 last month
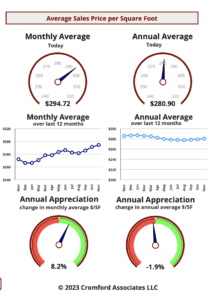
- Monthly Average Sales Price per Sq. Ft.: $295.19 versus $276.73 last year – up 6.7% – and up 3.4% from $285.40 last month
- Monthly Median Sales Price: $435,000 versus $436,000 last year – down 0.2% – but up 0.7% from $432,000 last month
An absence of pain can sometimes be experienced as pleasure, like when you stop banging your head against a wall. This principle applies to the Federal Reserve who decided NOT to raise the Federal Funds Rate at the start of November. The mortgage market had a huge party in response. The average 30-year fixed rate dropped from 7.88% on October 31 to 7.38% just 3 days later. The lower rates may possibly result in a recovery of demand during November, but the change was too late be reflected in any of the numbers above.
Demand remains surprisingly robust in the new home market, which has benefited from the weak supply in the re-sale market. New home pricing has increased much faster than re-sale pricing as a result. Offering mortgage rate buy-downs has been an important factor is maintaining this demand.
We now have to watch the demand numbers to see if buyers respond to rates under 7.5%.
Mid Month Pricing Update and Forecast
Each month about this time we look back at the previous month, analyze how pricing has behaved and report on how well our forecasting techniques performed. We also give a forecast for how pricing will move over the next month.
For the monthly period ending November 15, we are currently recording a sales $/SF of $297.10 averaged for all areas and types across the ARMLS database. This is up 3.4% from the $287.21 we now measure for October 15. Our forecast range mid-point was $291.00, so this month we significantly underestimated the price increase that would occur between mid October and mid November. The actual result sits just above our 90% confidence range.
On November 15 the pending listings for all areas & types show an average list $/SF of $320.78, almost unchanged from the reading for October 15. Among those pending listings we have 99.2% normal, 0.2% in REOs and 0.6% in pre-foreclosures. This is similar to the last 8 months and we still have very few distressed sales or foreclosures appearing.
Interest rates are seemingly high, causing a fluctuation in prices in the Housing Market. Catherine Kolodin, Designated Broker
“Asking prices are now on the rise and it does not take a big leap of imagination to see closed prices following suit during the second quarter.”
Catherine Kolodin, Designated Broker
Arizona Real Estate Market – Buyers/Sellers
For Buyers:
Buyers who felt they lost out on the buyer’s market last year will be getting another chance this year. The Greater Phoenix housing market, on the whole, only has a few days left before it enters a balanced market. However, as 18 cities are still in seller’s markets, there are 11 that are either already in balance or in buyer’s markets.
What does a buyer’s market mean for buyers? Most buyers assume it means that sales prices will come down, but by the time sales price measures show a decline the buyer’s market could be 2 months old, or already over like it was last year. The first thing to move isn’t a sales price, but a list price combined with higher seller incentives for buyers.
Over the past 2 months, as mortgage rates peaked at 8%, weekly price reductions increased in number by 33%. Meanwhile, the median seller incentive to buyers increased from $8,000 to a new high of $9,900 so far this November, the previous high was recorded last January at $9,700. Increases in the dollar amount and percentage of sales with incentives were most noticeable in the first-time home-buyer price range of $300K-$400K and also in cities with a significant number of competing new home communities.
How long this trend will last is unclear as conventional mortgage rates fell sharply this month to 7.3% and FHA/VA fell to 6.7%. The higher mortgage rates are, the higher the cost to the seller to buy them down. Mortgage rates have been near impossible for experts to predict over the past 18 months, however there are strong feelings that the end is near for rate hikes by the Federal Reserve. If mortgage rates decline in response, then the current market decline will be short lived.
For Sellers:
This is not a good time to test a price higher than market value for your home. As the seller’s market weakens on a daily basis, it’s the outskirts of town that are affected first as the interior cities follow quickly.
Seasonally, the best time to list your home is not in the 4th quarter. However, sellers always want to be selling in a seller’s market. While it’s not a bad idea to wait until the 1st quarter typically, under these circumstances the benefit could be offset by a weaker buyer’s market. That means more competition from new listings, more days on market, and more price reductions.
The determining factor that could change the course of the current market trend is mortgage rates, which have been unpredictable and volatile this year.
To stay informed of the ever-changing real estate market, Follow us on Instagram and Facebook. Facebook @MetroRealtyAZ Instagram @MetroRealtyAZ